
The Atlas of Australian Resources
- Publication
- Australian Geographer
- Volume
- 6
- Issue
- 2
- Pages
- 6–14
Summary
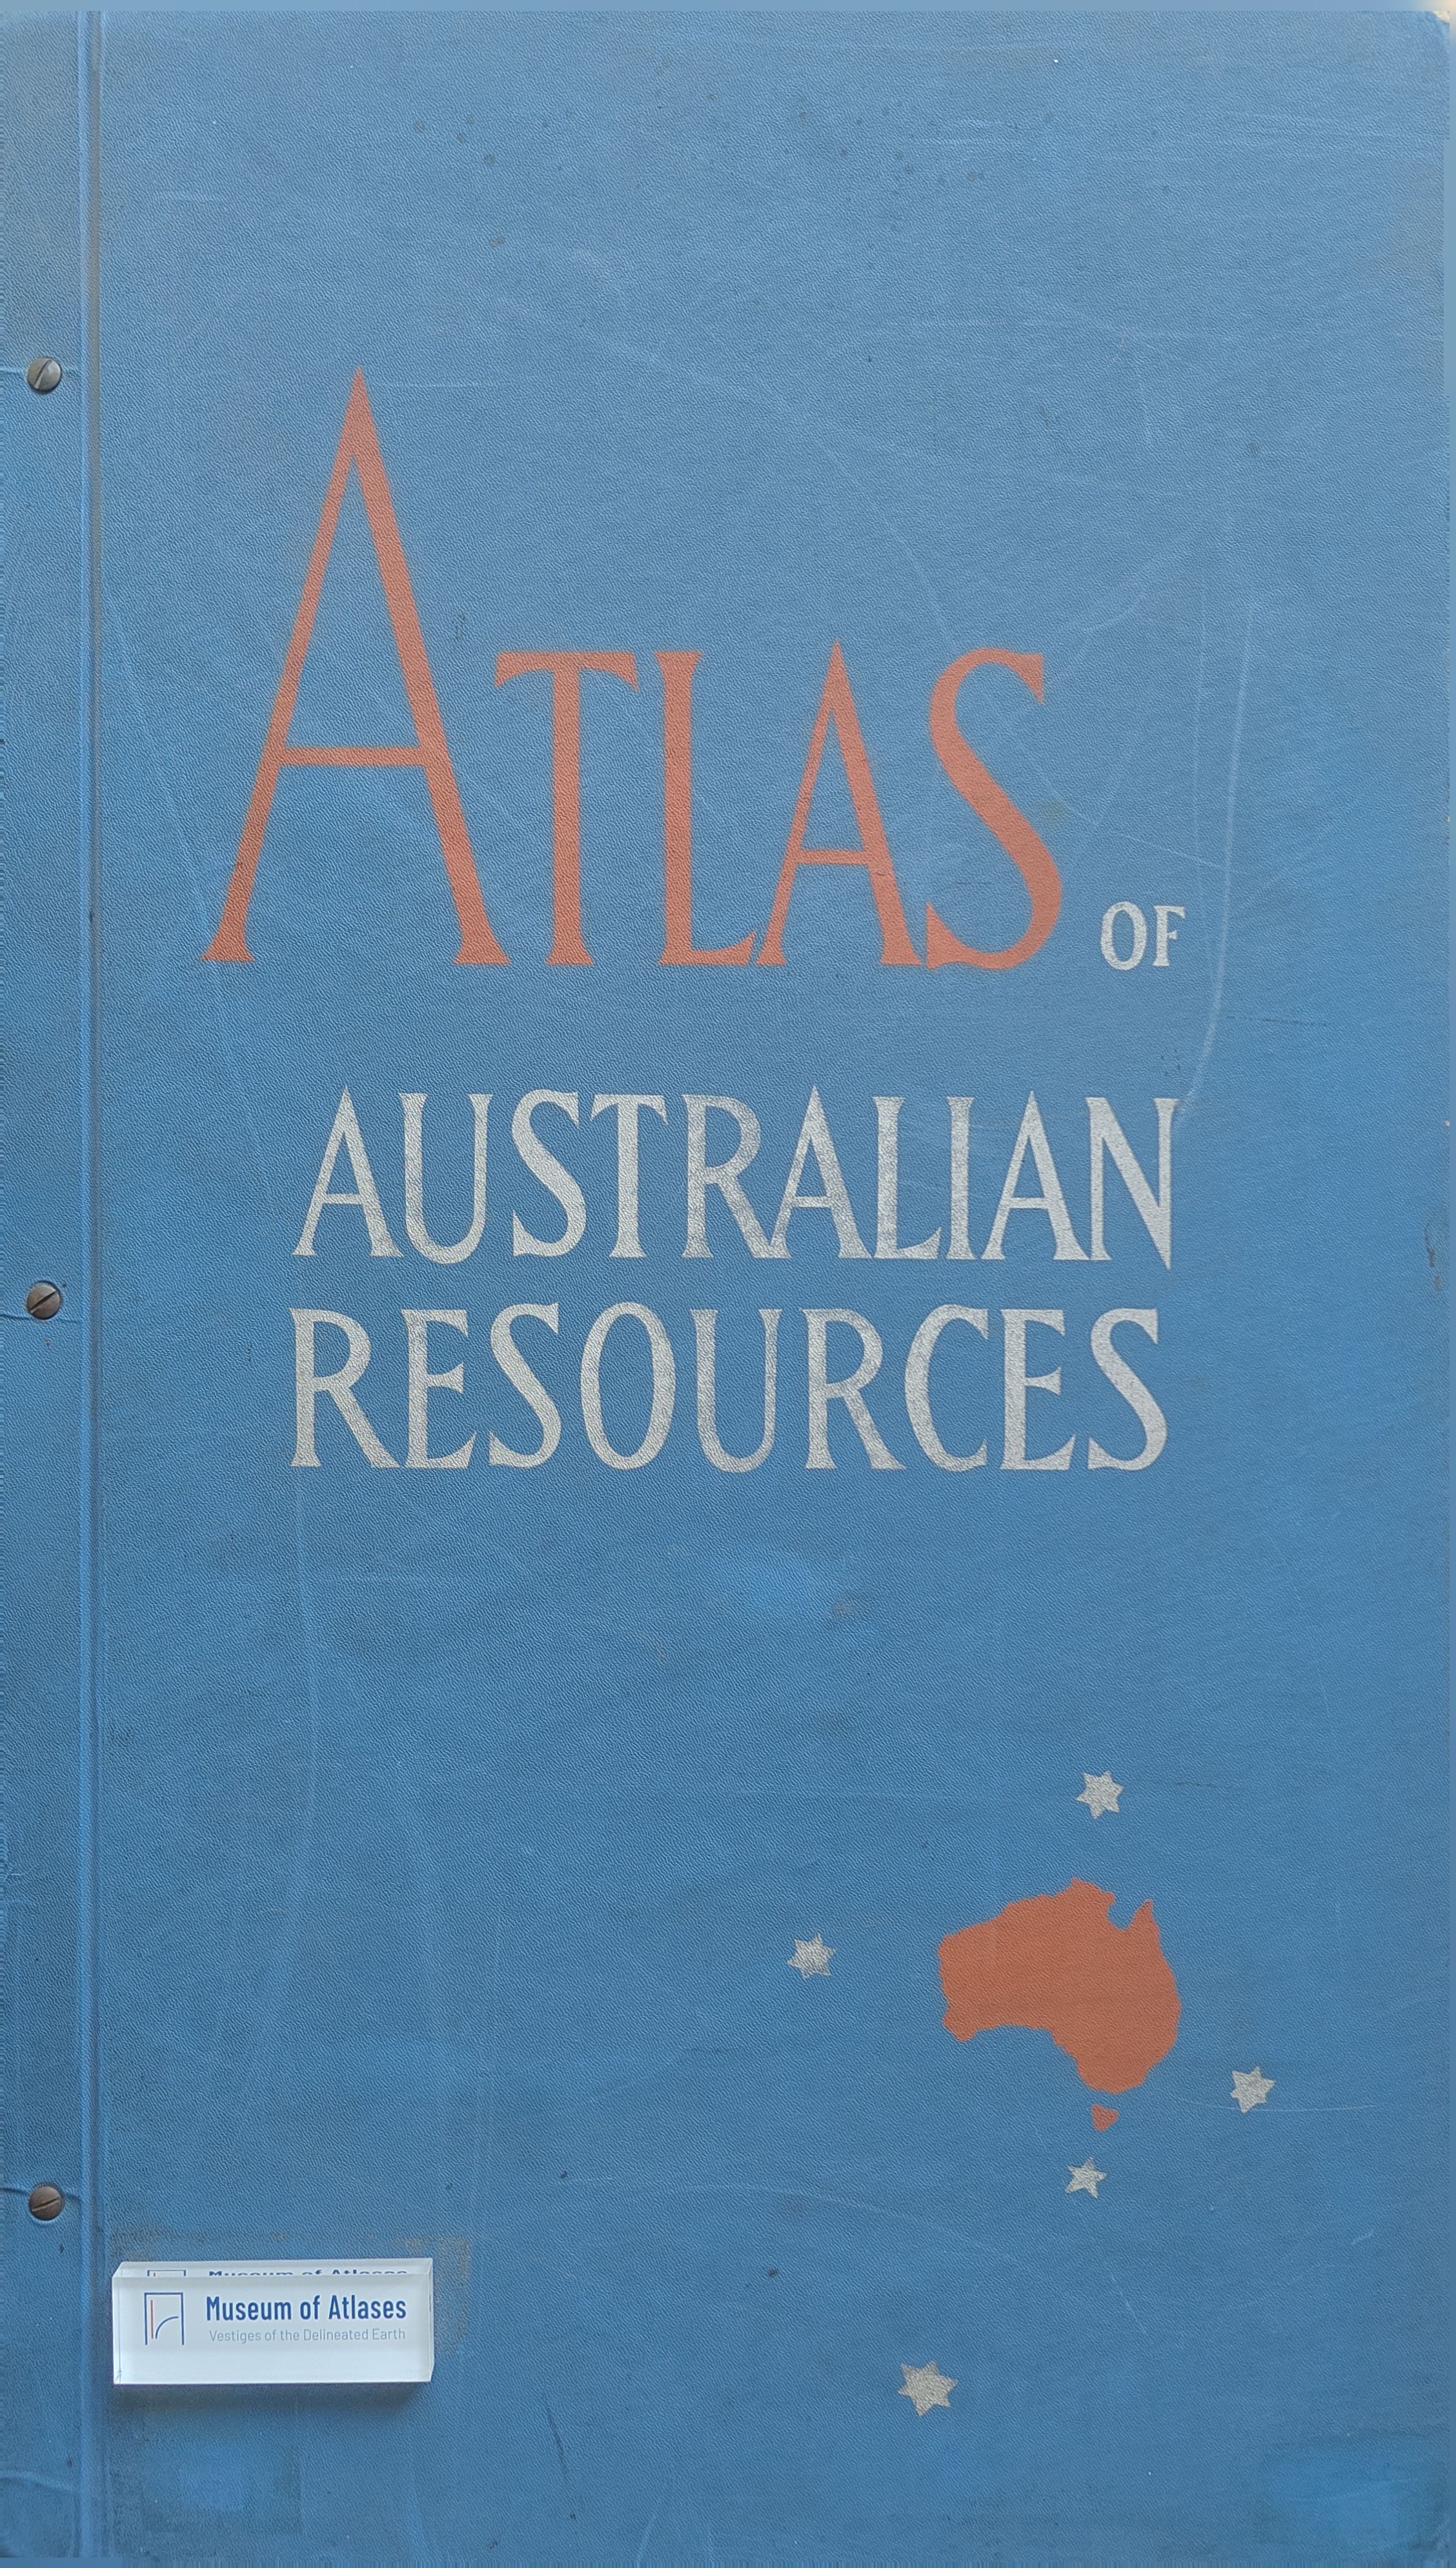
This article examines the conception, preparation, and initial contents of the Atlas of Australian Resources while presenting thematic cartography as a major contribution of geography to resource assessment and national planning. It first distinguishes thematic or special-purpose maps from exact topographic maps. Whereas geodetic surveying supplies a reliable locational base, thematic cartography selects and synthesizes scientific information and uses carefully designed symbols and colours to reveal the distribution of phenomena, their environmental relationships, and patterns of development. The author traces the expansion of resource atlases after the First World War, especially in Europe and in countries engaged in intensive planning or colonial development. As governments and planning agencies replaced scholarly organizations as principal sponsors, atlas contents broadened beyond physical geography, geology, population, and economic resources to include social conditions, services, administration, infrastructure, development trends, and proposed projects. Maps were particularly valuable because they could present complex relationships and regional contrasts in an immediately intelligible form. Against this international background, the Australian project emerged from post-war reconstruction and regional-development initiatives. Although several states had already produced valuable atlases and map series, their different histories, environments, survey practices, scales, and representational conventions prevented them from providing a coordinated national picture. The proposed atlas therefore sought to consolidate the extensive information accumulated by Commonwealth and State departments, explorers, officials, and research institutions into a reliable, uniformly scaled account of Australia as a whole. Intended initially for official use, it developed into a publication serving planners, scientists, businesses, politicians, and the wider public at home and overseas. Because the range of possible subjects was enormous, the editors selected topics that best represented Australia’s characteristic physical foundations, resources, development, and trends. The article stresses consistency of scale, symbol hierarchy, colour logic, visual balance, compilation, drafting, reproduction, and explanatory commentary. Examples from the first issue demonstrate these principles. The mineral map differentiates deposits by mineral group and relative importance through colour, symbol shape, fill, and identifying abbreviations. Rainfall and temperature are displayed in twelve maps arranged circularly, avoiding an artificial break between December and January and emphasizing the continuity of the annual climatic cycle; central and corner maps add annual totals, ranges, variability, sunshine, frost, thunderstorms, and extreme heat. The soils map uses yellow, orange, brown, and green to indicate arid, semi-arid, sub-humid, and humid zones while suggesting broad differences in fertility. The underground-water map identifies artesian and sub-artesian basins, availability, salinity, and flowing bores, while acknowledging that free groundwater cannot be represented adequately at the atlas scale. The article concludes that such an atlas requires close cooperation among geographers, cartographers, government agencies, and research bodies. It is intended both as a practical source of knowledge for Australians and as an international “window” or ambassador presenting the country’s resources and contemporary development.
Related Atlases
Comments
Loading...
0/2000