
Book Reviews: Additional Resources
- Publication
- Pacific Viewpoint
- Volume
- 2
- Issue
- 1
- Pages
- 114-116
Summary
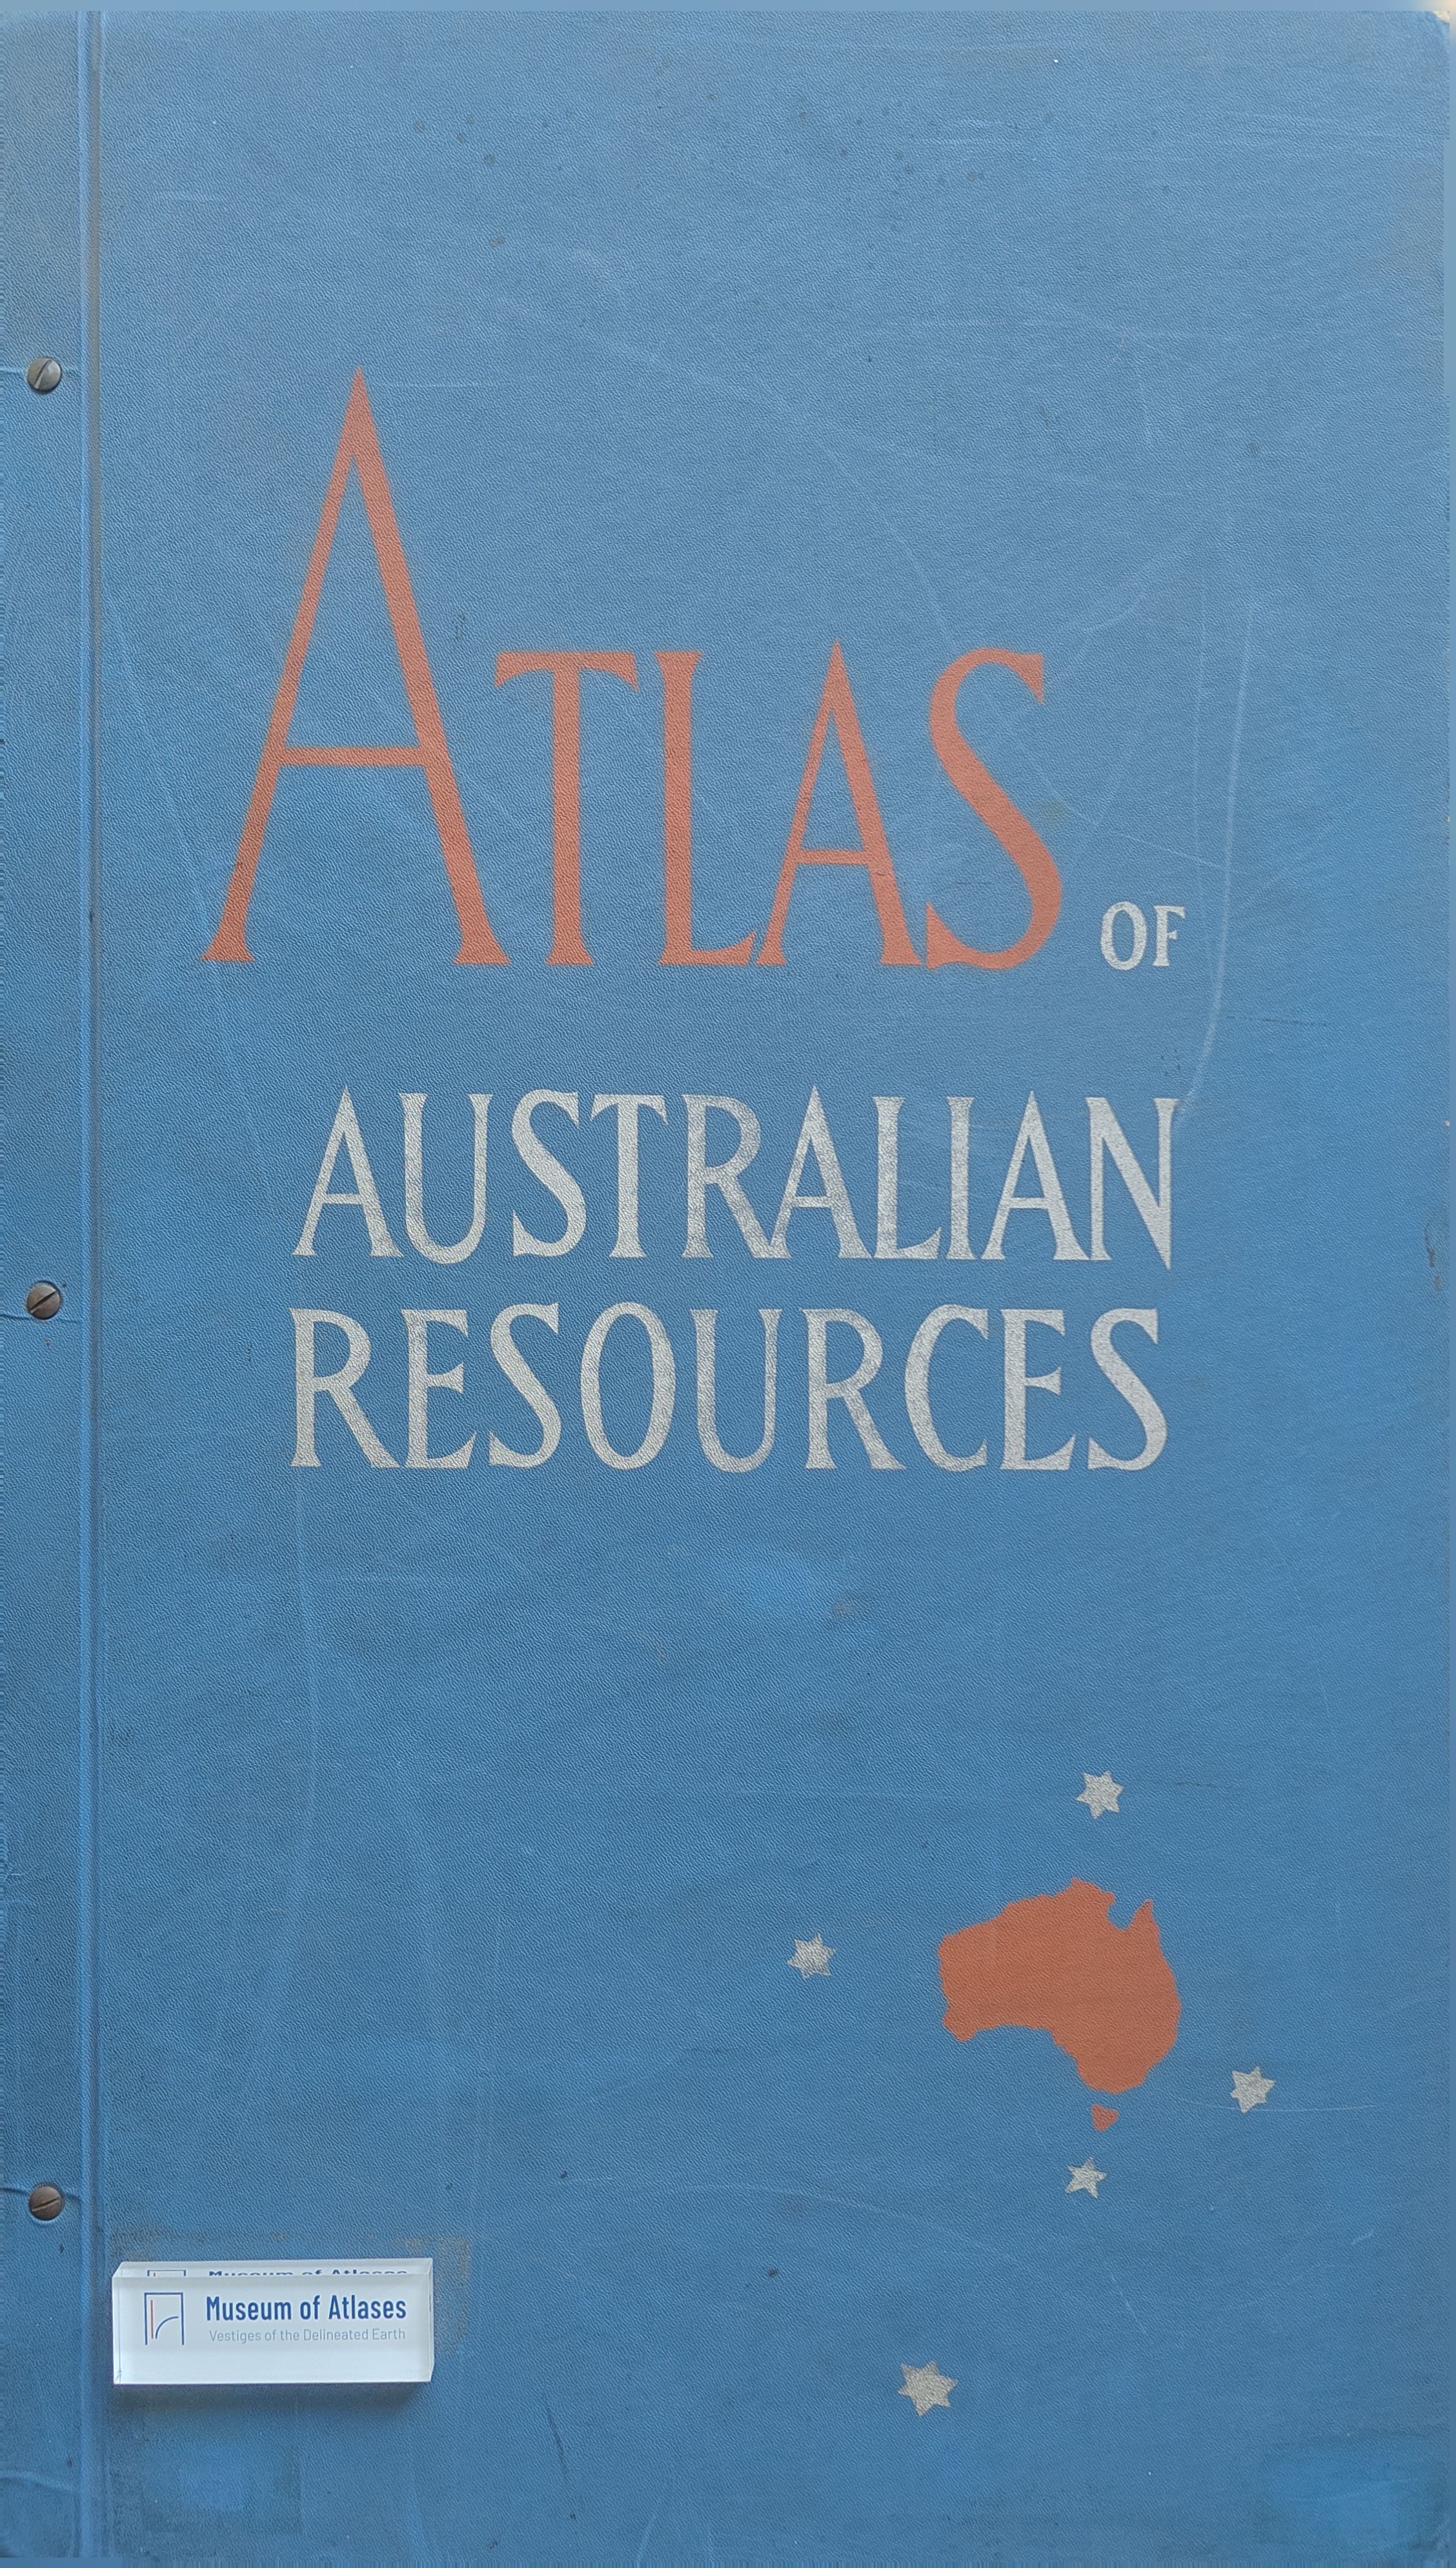
This review assesses five newly issued sheets in the Atlas of Australian Resources—Croplands, Geology, Immigration, Mineral Industry, and Manufacturing Industries—focusing on their substantive findings, cartographic methods, and value for interpreting Australia’s economic geography. The cropland maps identify two major post-war trends: declining wheat acreage and rising yields per acre. Their combination of mapping techniques is innovative, although several colour gradations and crop symbols lack sufficient contrast and reduce legibility. The geology sheet presents Australia’s development over roughly three billion years, clearly distinguishing the Western Plateau, Central-Eastern Lowlands, and Eastern Highlands and showing the association between the Precambrian shield and major mineral provinces. Its colour selection is generally effective, but greater use of value contrasts and superimposed symbols could reduce excessive reliance on hue. The immigration maps demonstrate the substantial effects of post-war migration on population growth, age structure, and urbanization; immigrants accounted for more than 60 percent of the growth of both Sydney and Melbourne between censuses. However, analyses of birthplace composition in State capitals and regional ethnic settlement would have strengthened the presentation. The mineral sheet effectively depicts production values, processing stages, and commodity flows, emphasizing the sector’s importance to future industrial expansion, though some labels are difficult to read. The manufacturing maps reveal strong concentration in capital cities and the dominance of New South Wales and Victoria, which together employed three-quarters of Australia’s factory workforce. Overall, the sheets combine rich information, skilled draughtsmanship, and often excellent colour design, offering a valuable picture of post-war Australian resources, population, and industry, while leaving room for improvement in colour scaling, symbol clarity, and comparative visualization.
Related Atlases
Comments
Loading...
0/2000